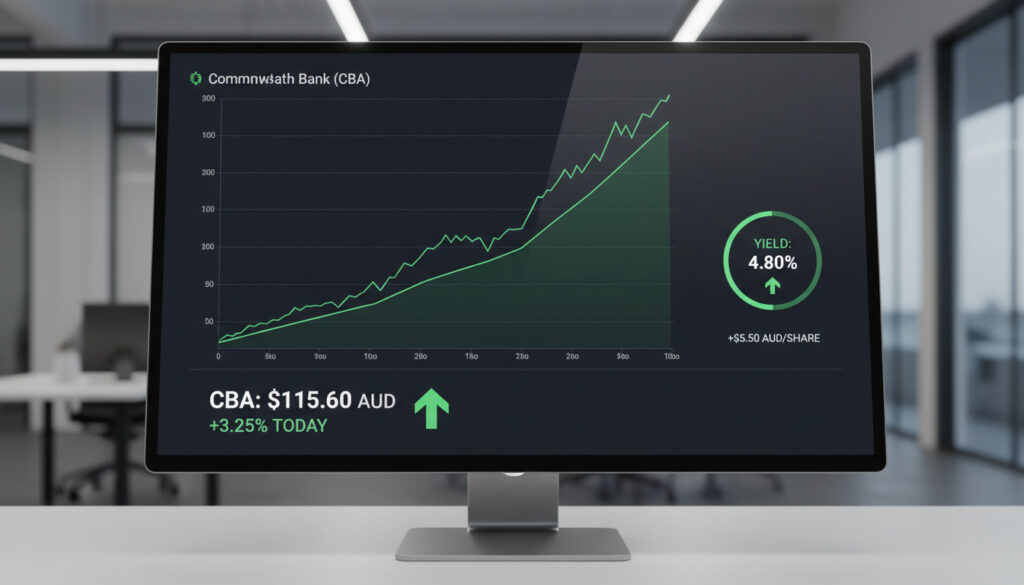
Commonwealth Bank Shares – Price Yield and Investment Guide
Commonwealth Bank of Australia shares have oscillated between A$150.48 and A$173.63 in recent trading sessions, reflecting volatile market conditions across the banking sector. The stock, listed on the Australian Securities Exchange under ticker CBA, commands a market capitalisation of roughly A$199.47 billion, cementing its position as the largest domestic lender by value.
Daily price swings have ranged from -2.98% to +1.38%, with trading volumes fluctuating between 897,000 and 4.41 million shares depending on market catalysts. The institution’s shares currently offer a trailing dividend yield of 3.22%, though valuation metrics vary significantly across data providers, with normalized price-to-earnings ratios quoted between 24.10 and 30.48.
For investors evaluating exposure to Australia’s financial sector, understanding CBA’s premium valuation relative to competitors, its historical trajectory from the 2020 pandemic lows, and the mechanics of purchasing shares through ASX brokerage platforms remains essential.
What Is the Current Commonwealth Bank Share Price and Performance?
- 52-week volatility: Shares have traded between A$140.21 and A$192.00, indicating a A$51.79 range.
- Recent momentum: Four-week highs reached A$157.26, though twelve-month performance shows a slight decline of 1.05%.
- Volume spikes: Daily turnover has exceeded 4 million shares during volatile sessions, contrasting with quieter periods below 1 million.
- Historical growth: Annual returns reached 27.71% in 2024, following 16.19% in 2023, recovering from a 3.43% contraction in 2022.
- Share structure: Approximately 1.67 billion shares remain outstanding.
- Valuation spread: Price-to-book ratio sits at 3.19, while price-to-sales reaches 8.80.
| Metric | Value | Source Period |
|---|---|---|
| 52-Week High | A$192.00 | Recent range |
| 52-Week Low | A$140.21 | Recent range |
| Market Capitalisation | A$199.47B | February 2026 |
| PE Ratio (Normalized) | 24.10 | Current |
| Alternative PE Ratio | 30.48 | Alternative calculation |
| Dividend Yield | 3.22% | Trailing |
| Price/Book | 3.19 | Current |
| Price/Sales | 8.80 | Current |
What Is the Dividend Yield and History for CBA Shares?
Current Dividend Metrics
The bank currently offers a trailing dividend yield of 3.22%, providing income-oriented investors with a steady cash flow component alongside capital exposure. This yield sits within the range typical for major Australian banks, though the absolute dividend amount varies semi-annually based on profitability and regulatory capital requirements.
Historical Distribution Patterns
Dividend sustainability has tracked the bank’s earnings recovery since 2020. Following the June 2020 year-end price of A$69.42, distributions have generally trended upward alongside the share price appreciation to A$127.38 by June 2024. The bank’s operating profit of A$7.34 billion and pre-tax profit of A$7.26 billion provide coverage for current payout ratios, though historical charts indicate variability during stress periods.
Future Payment Timing
The precise date and amount of the next dividend declaration remain unconfirmed in available disclosures, as board approvals typically precede ex-dividend announcements by several weeks. Investors should monitor official investor relations channels for definitive payment schedules.
While Commonwealth Bank maintains a consistent dividend policy with a 3.22% trailing yield, future payments depend on regulatory capital ratios and half-yearly profit results. The bank has historically paid dividends twice yearly, though exact dates require verification through official ASX announcements.
Is Commonwealth Bank a Good Share to Buy?
Analyst Valuation Assessments
Commonwealth Bank share price targets vary significantly across research houses. Trading Economics forecasts the stock reaching A$157.80 by the first quarter of 2026, with a one-year target of A$148.25. However, Morningstar presents conflicting valuation data, listing a fair value estimate of A$977.00—a figure implying substantial premium to current trading ranges, accompanied by medium uncertainty ratings. This discrepancy suggests investors should treat single-source valuations with caution.
Peer Comparison Matrix
Relative to the big four banks, CBA trades at a significant valuation premium:
| Metric | CBA | ANZ | NAB |
|---|---|---|---|
| PE Ratio (Normalized) | 24.10 | 11.55 | 18.02 |
| Price/Book | 3.19 | 1.55 | 2.03 |
| Price/Sales | 8.80 | 5.27 | 6.29 |
The data indicates investors pay approximately twice the price-to-book multiple for CBA compared to ANZ, suggesting the market prices in superior growth expectations or lower perceived risk.
Profitability and Financial Health
Recent financials show net income of A$4.98 billion, with operating profit at A$7.34 billion. These figures support the current dividend yield but also raise questions about whether profit growth can justify the 24.10 PE ratio when competitors trade at significant discounts.
Commonwealth Bank’s normalized PE ratio of 24.10 exceeds ANZ’s 11.55 by over 100%, meaning investors currently pay more than double per dollar of earnings compared to some competitors. This premium assumes continued outperformance that historical volatility—such as the 2022 decline of 3.43%—may not guarantee.
How Do I Buy Commonwealth Bank Shares?
Brokerage Platforms
Australian investors access CBA shares exclusively through the Australian Securities Exchange. Registration with an online brokerage—such as CommSec (operated by Commonwealth Bank itself), or independent platforms—provides the necessary clearing and settlement services. No direct share purchase plan bypassing the ASX is available; all transactions execute through the central limit order book.
Investment Mechanics
Minimum investment sizes depend on the broker’s terms, though the ASX generally facilitates trades from approximately A$500 excluding fees. Settlement occurs on a T+2 basis. Real-time pricing data remains accessible through the CBA stock quote services and the bank’s official investor centre.
While CommBank owns CommSec, investors may use any ASX-participating broker to purchase shares. Third-party platforms often offer competitive brokerage rates for high-volume traders, though mobile banking integration may favour CommSec for existing Commonwealth Bank customers. For those interested in broader market trends, Mercati finanziari Italia FTSE MIB quotazioni provides valuable insights.
How Has the CBA Share Price Changed Over Time?
- : Shares closed at A$69.42, representing the pandemic-era low as interest rates collapsed and loan deferrals peaked.
- : Recovery to A$99.87 as capital buffers strengthened and dividend restrictions lifted.
- : Retreated to A$90.38, recording an annual decline of 3.43% amid rising rate volatility.
- : Broke the A$100 barrier to close at A$100.27, delivering 16.19% annual growth.
- : Surged to A$127.38, marking a 27.71% annual gain driven by margin expansion.
- : Recorded the highest end-of-day price at A$127.64, with the market cap approaching A$200 billion.
Historical data sourced from Market Index and Companies Market Cap confirms the trajectory from 2020 lows to current levels near A$150-173 represents more than doubling in share price value.
What Do We Know About CBA’s Future Performance?
| Established Information | Uncertain Information |
|---|---|
| Net income of A$4.98B supports current dividends | Exact timing of next dividend declaration |
| 52-week range definitively spans A$140.21–192.00 | Whether shares will reach Q1 2026 forecast of A$157.80 |
| Premium valuation vs ANZ and NAB is current fact | Sustainability of PE ratio above 24 given peer averages |
| Operating profit of A$7.34B as of recent reports | Impact of future RBA interest rate adjustments on net margins |
| Historical volatility includes 2022 negative returns | Long-term maintenance of 2024’s 27.71% growth rates |
Why Does CBA Dominate the ASX Banking Sector?
Commonwealth Bank’s market capitalisation of approximately A$199.47 billion exceeds that of its nearest rivals by a significant margin, reflecting both its scale and the market’s willingness to assign premium multiples to its earnings. The bank’s retail banking dominance, technological infrastructure, and brand recognition among Australian consumers support this valuation gap.
The institution’s ability to command a PE ratio of 24.10—nearly double that of ANZ—suggests investors view CBA as having superior defensive characteristics or growth prospects. However, this positioning also concentrates risk; any deterioration in credit quality or regulatory pressure on mortgage pricing could disproportionately impact the sector’s largest constituent.
What Do Analysts and Official Sources Say About CBA?
Morningstar assesses CBA as trading within a fairly valued range, assigning a fair value estimate of A$977.00 with medium uncertainty, though this figure appears inconsistent with current market prices around A$150–173 and may reflect a data entry discrepancy.
Morningstar Equity Research
Trading Economics forecasts the Commonwealth Bank share price to reach A$157.80 by the first quarter of 2026 and A$148.25 over a one-year horizon, suggesting modest appreciation potential from current levels.
Recent trading sessions saw volumes between 897,000 and 4.41 million shares, with daily percentage changes ranging from -1.13% to +1.38%, indicating sustained institutional interest despite price volatility.
Key Takeaways for Potential Investors
Commonwealth Bank shares currently trade between A$150.48 and A$173.63, carrying a premium valuation reflected in a 24.10 PE ratio and 3.22% dividend yield. While the bank dominates the ASX with a A$199.47 billion market cap and demonstrates strong profitability with A$7.34 billion in operating profit, investors must weigh these strengths against the stock’s significant valuation gap versus competitors like ANZ and NAB. Purchases execute through standard ASX brokerage accounts, with Commonwealth Bank share price data available through multiple verified sources.
Frequently Asked Questions
What are the latest news on CBA shares?
Recent activity includes the stock hitting a four-week high of A$157.26, though twelve-month performance remains slightly negative at -1.05%. Volume has fluctuated between 897,000 and 4.41 million shares in recent sessions.
How does CBA compare to other bank shares?
CBA trades at a significant premium to peers, with a PE ratio of 24.10 compared to ANZ’s 11.55 and NAB’s 18.02. Its price-to-book ratio of 3.19 also exceeds ANZ’s 1.55 and NAB’s 2.03.
What is the PE ratio for Commonwealth Bank shares?
Data sources report conflicting normalized PE ratios of 24.10 and 30.48, suggesting calculation methodology differences. Both figures place CBA at a premium to the sector average.
When is the next dividend payment for CBA?
The bank typically distributes dividends semi-annually, with exact dates subject to board approval and ASX announcement. The current trailing yield stands at 3.22%.
What is the 52-week high and low for CBA shares?
Over the past 52 weeks, CBA shares have traded between a low of A$140.21 and a high of A$192.00, representing a range of A$51.79.
More related posts
 Annie Wersching: Cause of Death, The Rookie Role, Legacy
 Joe Jackson: Life, Legacy, Relationship With Michael Jackson
 Robin Williams’ Cause of Death and Final Days: Full Story
 De Facto: Definition, Examples, and Irish Immigration Guide
 Nick Cannon: Kids, Health, and Son Zen’s Death
 Wolf Creek Movie: Is It Worth Watching? Complete Guide
 In the Lost Lands: Worth Watching? Cast, Reviews & Release
 Morgan Wallen: Biography, Controversies & Personal Life
